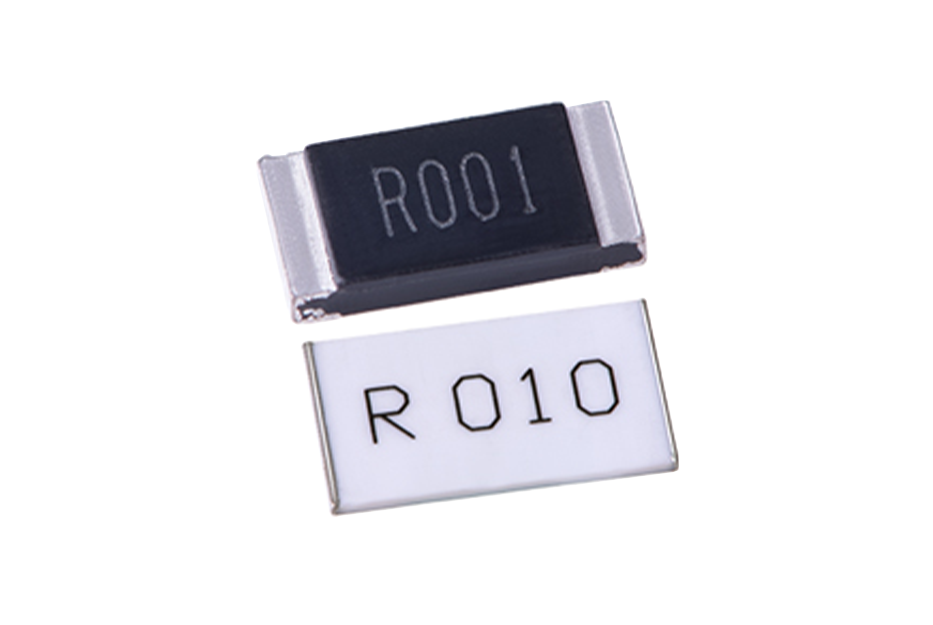
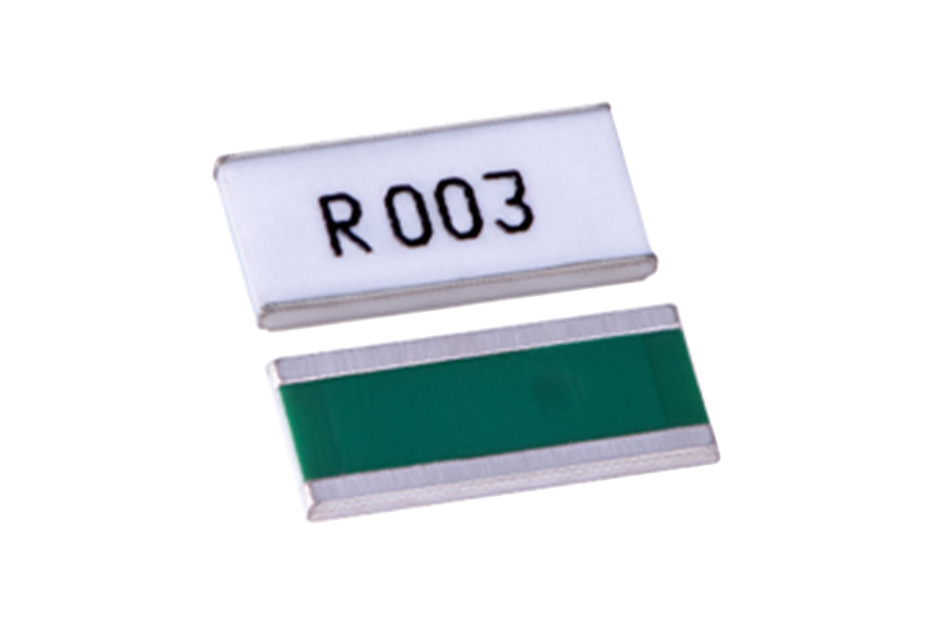
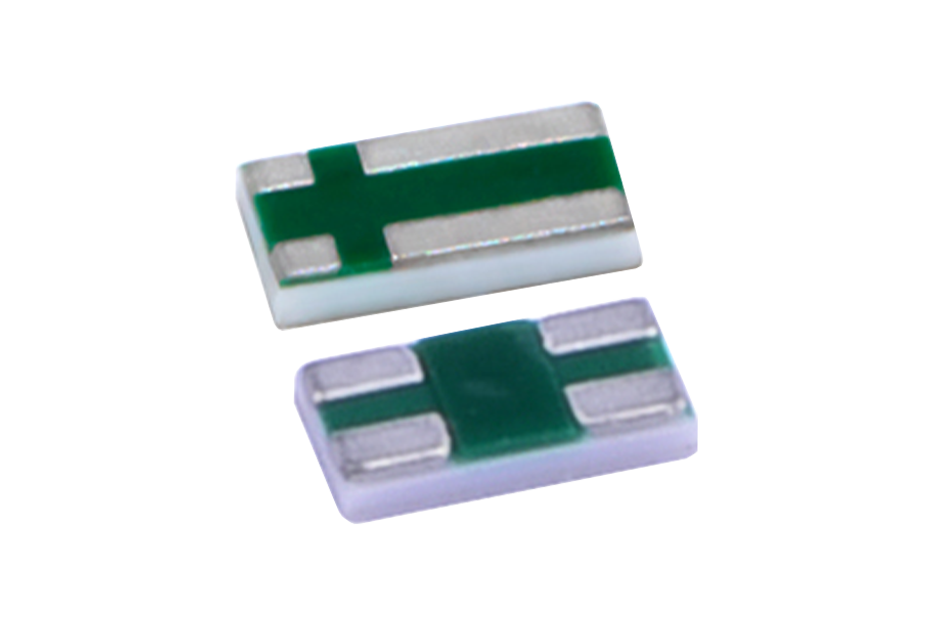
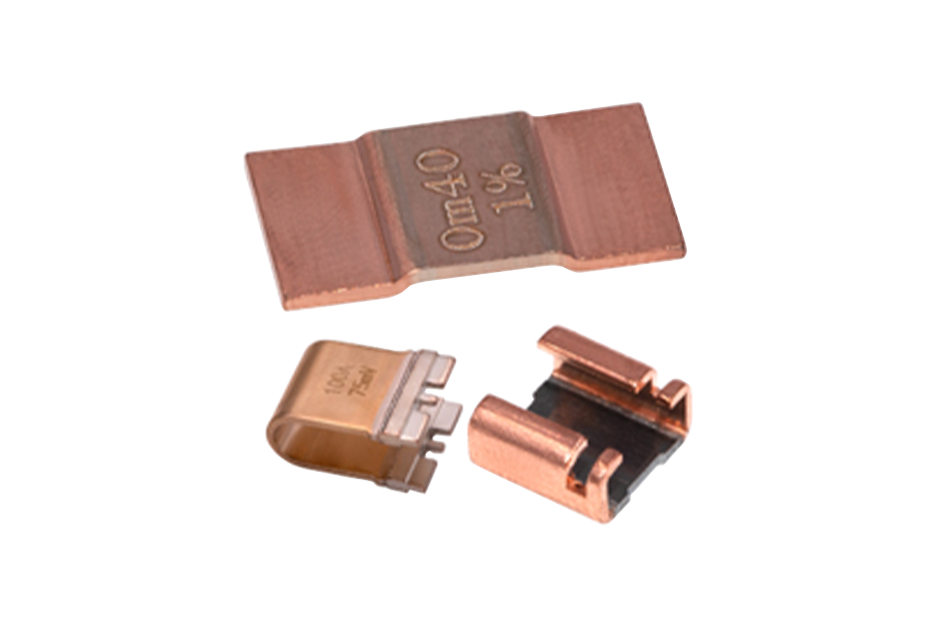


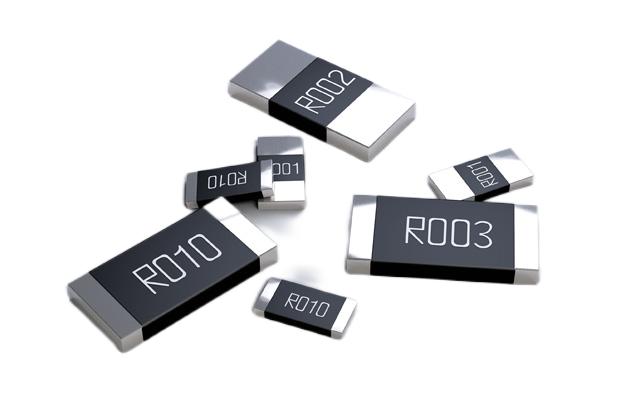


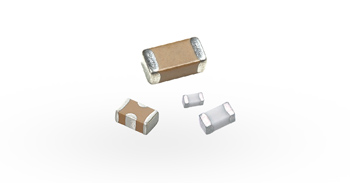
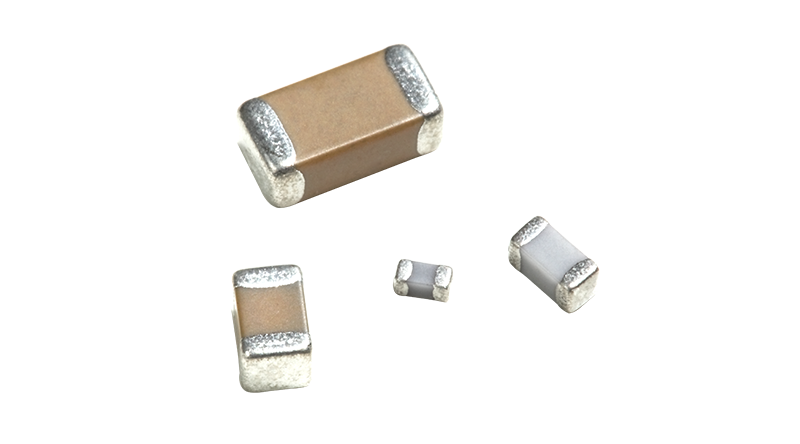


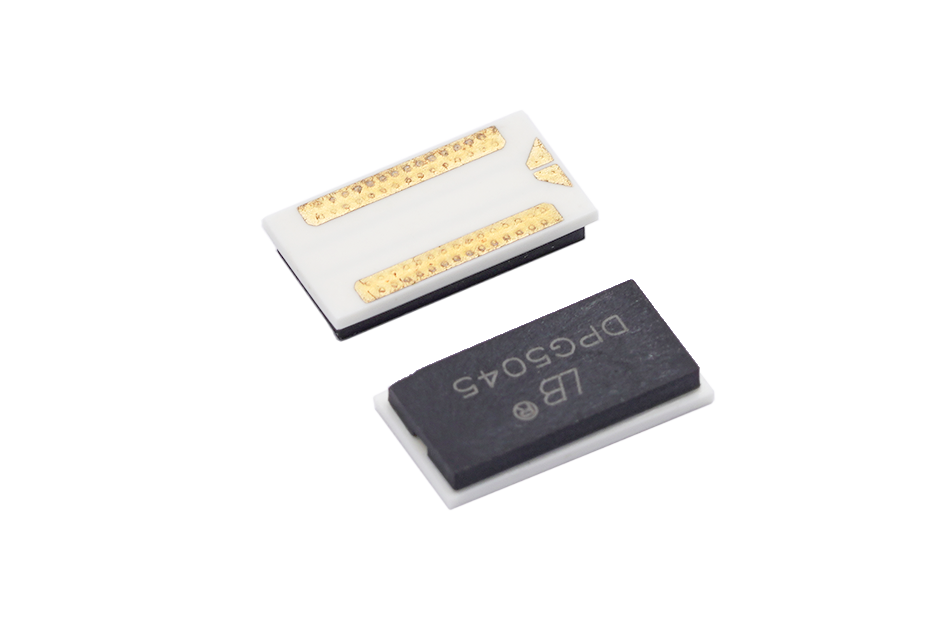


The core product of the LR series short edge electrode sampling resistor SUSUMU sampling resistor has high stability, strong universality, and wide circulation. Featuring a unique heat dissipation structure, the product is miniaturized to reduce the impact on surrounding components. The main volumes of LR series sampling resistors include LR0510, LR0816, LR1220, and LR1632. The resistance value can be selected widely. This article introduces the SUSUMU short edge electrode sampling resistance LR series.
The main characteristics of the LR series of short edge electrode sampling resistors:
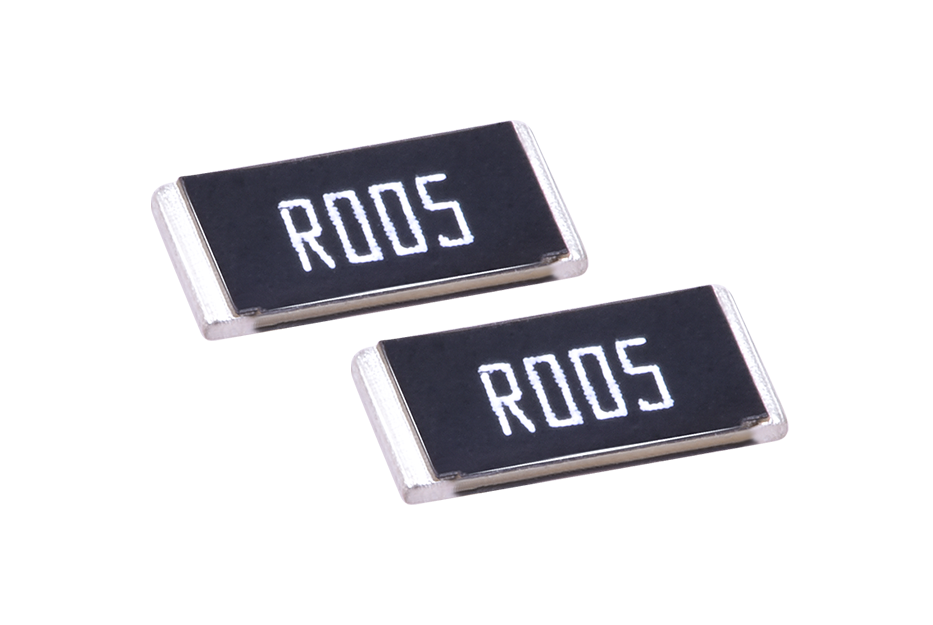
The unique heat dissipation structure controls the surface temperature rise, achieving miniaturization and minimizing the impact on surrounding products.
The main application markets of the LR series of short edge electrode sampling resistors are:
PC and computer peripherals, power devices, AV devices, connectors, office products, mobile communication products, etc.
Naming rules for the LR series of short edge electrode sampling resistors:
| series | power | temperature coefficient | Resistance value (Ω) range and accuracy (%) | temperature | Number of packages | ||
| ppm/℃ | 1%(F) | 2%(G) | 5%(J) | ||||
| RL0510 | 1/8W | 0~350(T) | 50mR≤R≤100mR | -55~125℃ | 10000 | ||
| 1/6W | 0~200(S) | 100mR≤R≤47R | - | ||||
| 5.1R≤R≤47R | |||||||
| RL0816 | 1/4W | 0~200(S) | 20mR≤R≤100mR | 5000 | |||
| 0~350(T) | |||||||
| 1/5W | 0~100(R) | 100mR≤R≤6.8R | - | ||||
| 0~200(S) | 7.5R≤R≤68R | ||||||
| RL1220 | 1/4W | 0~200(S) | 43mR≤R≤91mR | ||||
| 0~350(T) | 10mR≤R≤100mR | ||||||
| 1/3W | 0~100(R) | 100mR≤R≤10R | |||||
| 0~200(S) | 11R≤R≤100R | ||||||
| RL1632 | 0~100(R) | 510mR≤R≤4.7R | 56mR≤R≤470R | - | T1/T5 | ||
| 0~200(S) | - | 33mR≤R≤51mR | |||||
| 0~350(T) | 27mR≤R≤30R | 18mR≤R≤24mR | |||||
| 0~500(T) | - | 10mR≤R≤16mR | |||||
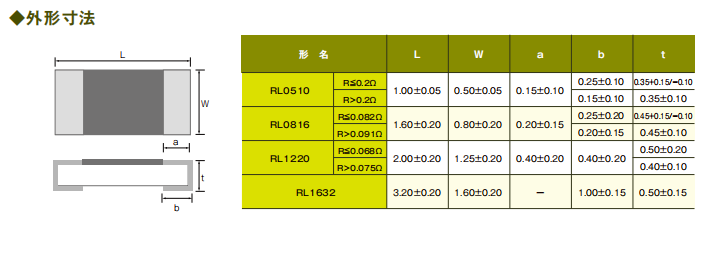
Outline dimension diagram of short edge electrode sampling resistor LR series:
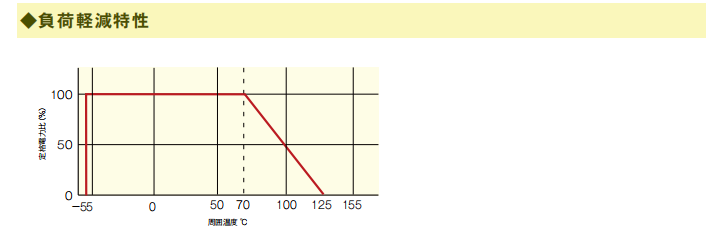
Load attenuation curve of short edge electrode sampling resistor LR series:
Short edge electrode sampling resistor LR series pulse resistance characteristic curve diagram:
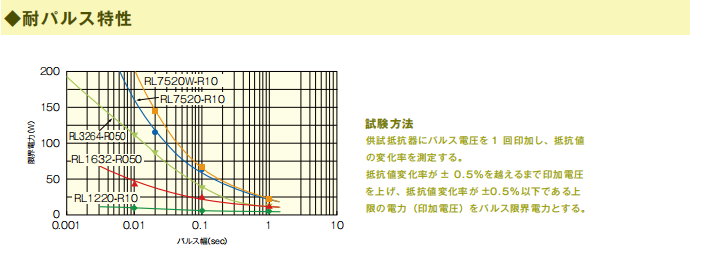
Pulse resistance experiment method: Input a pulse voltage once to the tested resistor and measure the rate of change of the resistance value. The upper limit pulse voltage refers to the online voltage (input voltage) that is continuously pressurized until the resistance change rate exceeds ± 0.5%.